Hands-on: Measuring the studio correctly and optimizing sound
The way to a sound optimized room
1 Room EQ wizard
The first step on the way to an acoustically optimized mixing room is to analyze the sound characteristics using the free Room EQ Wizard software and a measuring microphone. In this way, problem areas can be identified and included in the module planning. To do this, we download the REQ software from www.roomeqwizard.com and get a suitable measuring microphone.

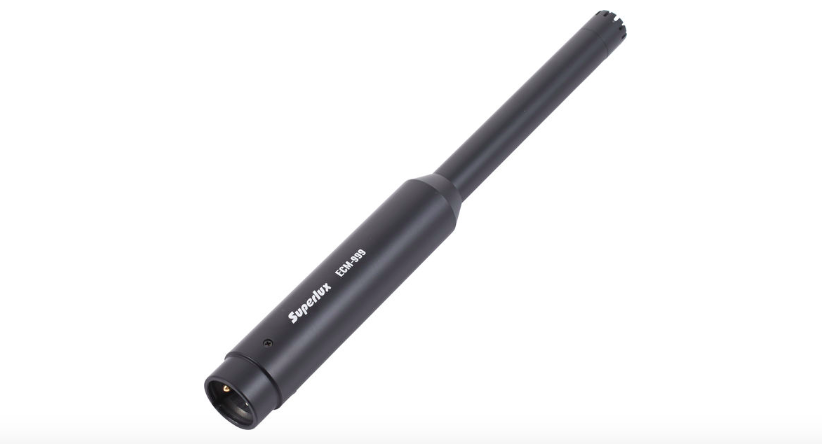
2 Suitable measuring mic
If you do not have a neutral mic preamp, the Room EQ Wizard homepage recommends the USB condenser measurement microphone miniDSP UMIK-1. If, on the other hand, a suitable preamp is available, cheaper measurement mics will suffice, such as the Superlux ECM999. We already have an adequate measurement microphone at the start and immediately get to work on the measurement preparations.
3 General conditions
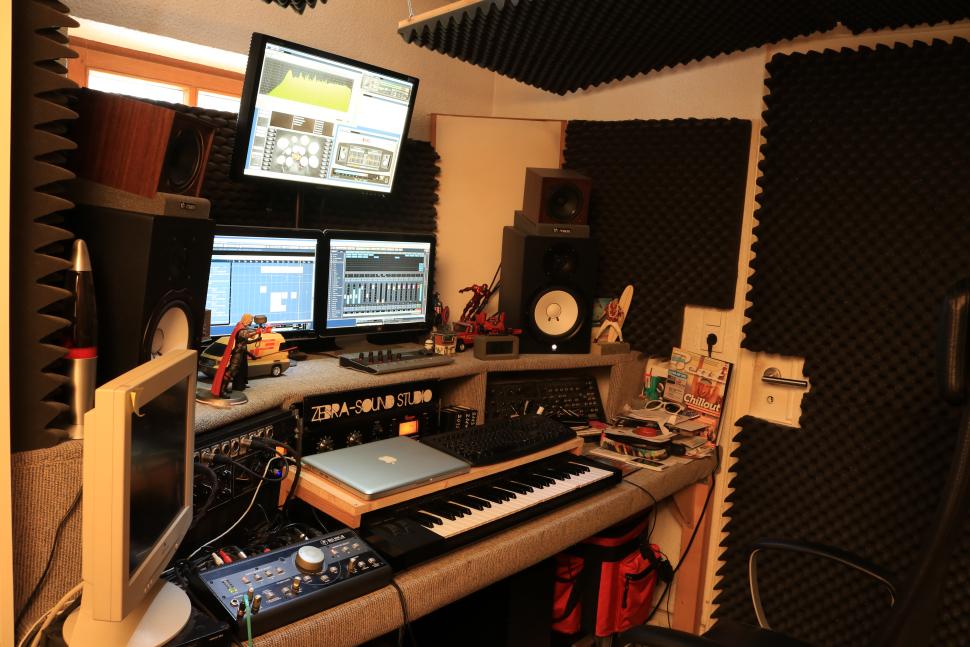
At the time of the first measurement, the room should already contain all the interior furnishings that, together with the room acoustics modules from Browne Acoustics, will later form the final design of the room. This includes carpets, studio table, studio monitors, computer screen as well as, if necessary, 19-inch racks or other furnishings that have an influence on the room acoustics.
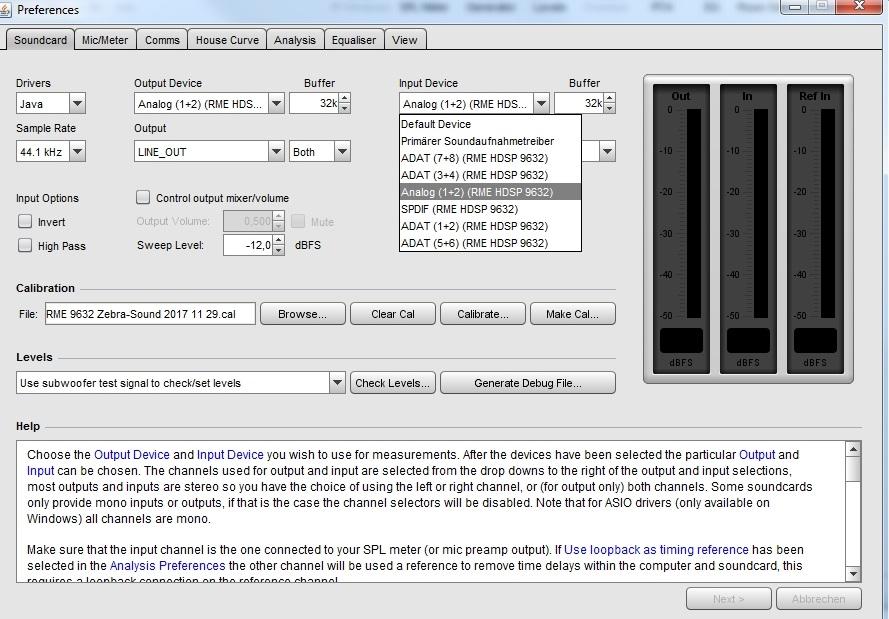
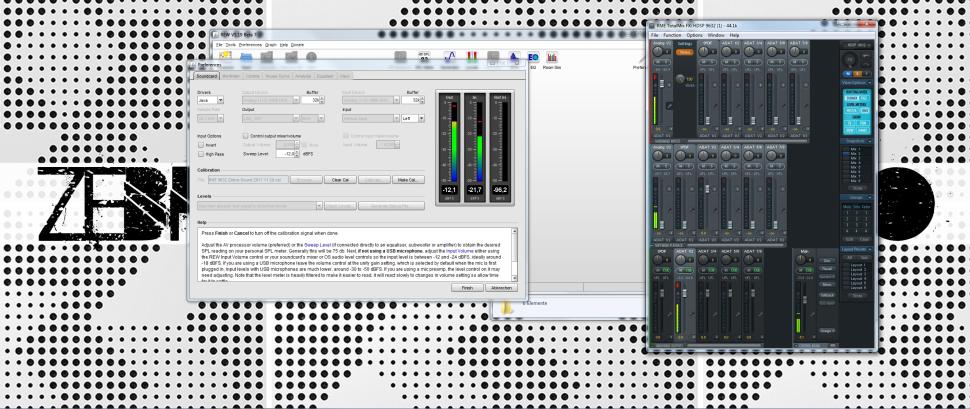
4 Audio interface wiring
Before the measurement, we have to calibrate REW for the audio interface we are using and first select the java entry in the preferences under drivers. Then we set the output volume on the interface or monitor controller to zero to avoid feedback. Next we connect one of the inputs to an output of the audio interface. Let‘s continue with the calibration.
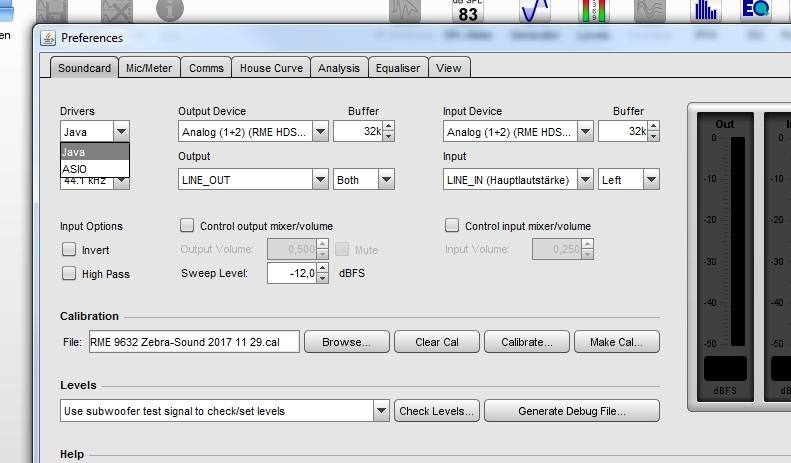
5 Calibration preparation
Now we select in the preferences in the soundcard tab under output device + output the input connected to the interface and under input device + input the connected interface output. Then we press the calibrate button, whereupon we confirm the established loop connection by pressing the next button at the bottom of the REW window. Another click on next starts a connection test.
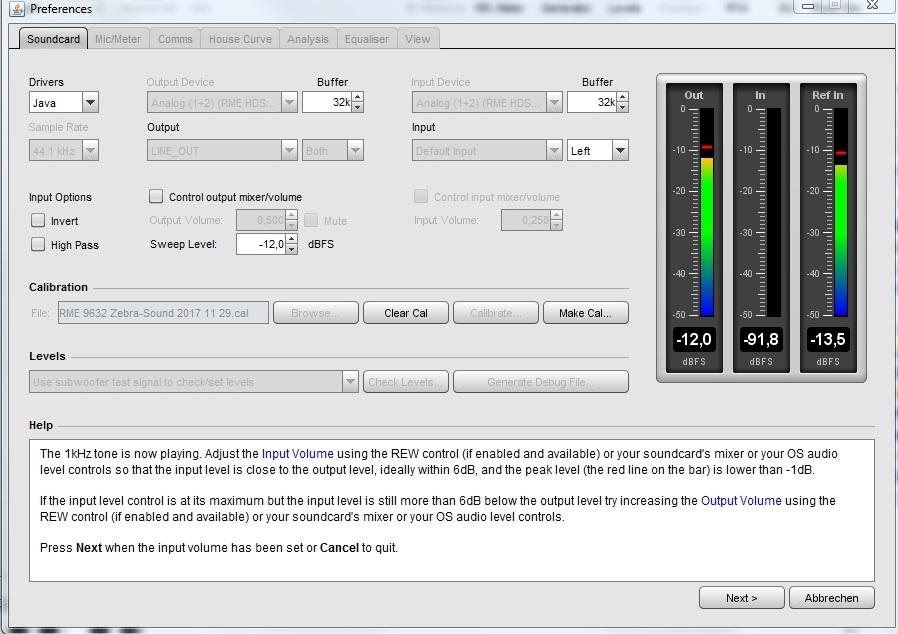
6 Calibration test
For this purpose, the program sends a test tone through the just established loop connection between the input and the output of the audio interface. If the connection is correct, the input and output level meters should show a clear deflection. Both levels should be as congruent as possible and differ by a maximum of 6 dB. In case of a larger deviation, we have to readjust manually.
7 Mic setup
If everything fits, we click next again and the calibration starts. Then we save the generated calibration file to a safe location using the make cal... button. With the freshly calibrated REW software, we can now continue with the measurement. To do this, we connect the measurement microphone and preamp to the input we just used and make sure that the audio interface is connected to the speakers.
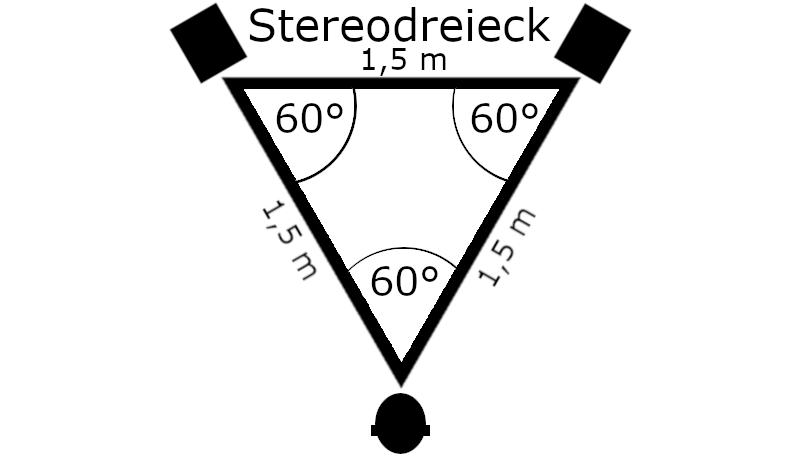
8 Set up measuring mic
For a correct measurement at our listening position, we place the microphone where we are sitting on our chair in front of the studio monitors (keyword: stereo triangle). There we place the microphone standing upright on a microphone stand, with the capsule facing up and at the level of our ears. Then we select use main speaker test signal... and check the connection via the check levels button.
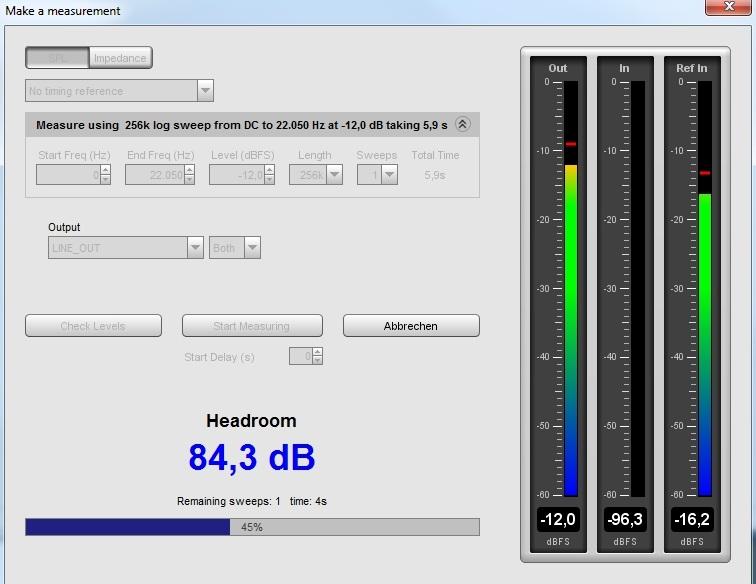
9 Perform measurement
Now we hear test noise from the speakers. We level this signal recorded by the measurement microphone at the mic preamp so that it lies between -12 and -24 dB. If everything is correct, we press finish. Finally, we leave the direct sound field of the studio monitors, start the sweep measurement in the measurements window by pressing the start measuring button and save it.
Evaluation of measurement results
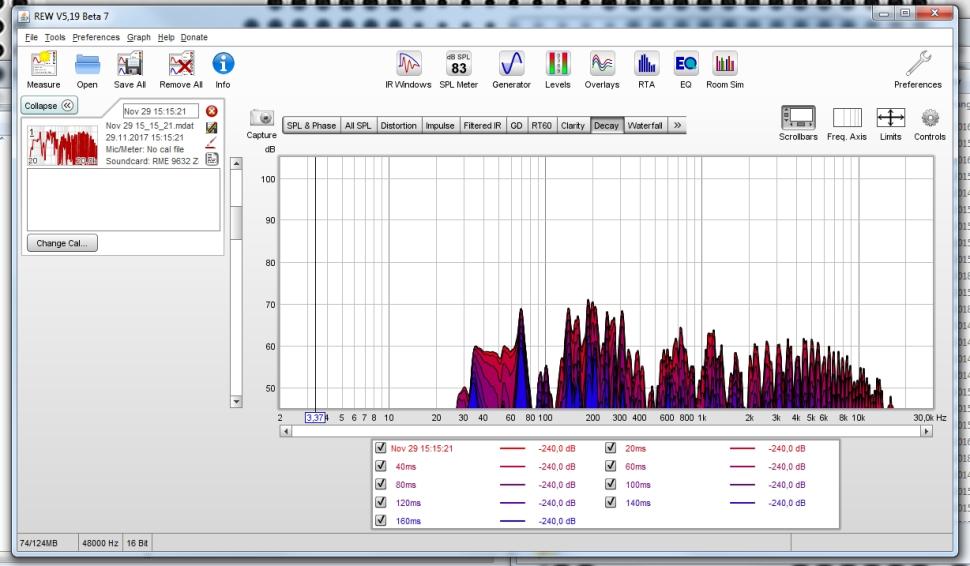
1 Understand measurements
After the measurement process, REW presents us with the results in the form of a three-dimensional frequency response diagram. Its X-axis shows us not only the frequency response of the room impulse response with the level response on the Y-axis. The Z-axis shows us the corresponding decay or reverb time, which is a decisive evaluation criterion for our room.
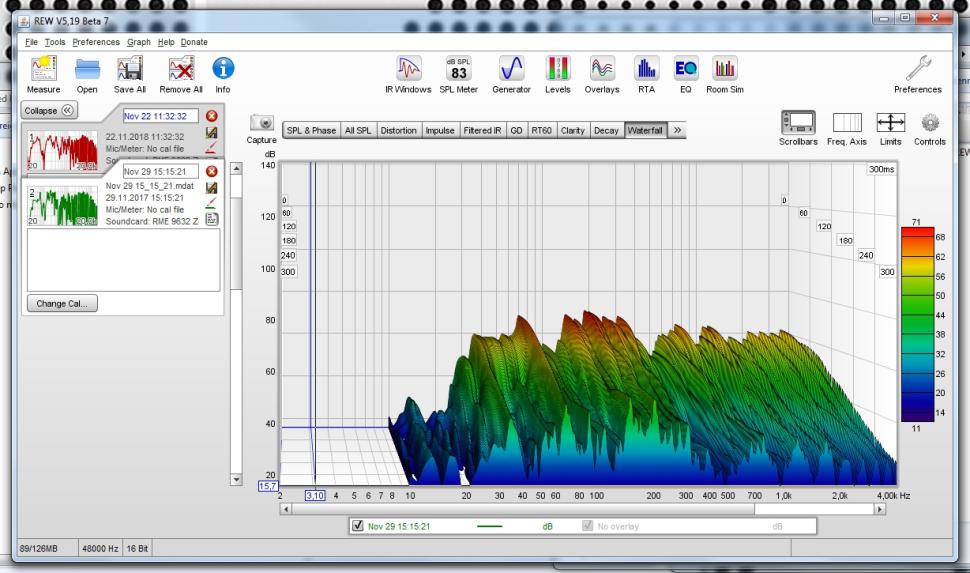
2 The decay time makes the difference
Both in the waterfall diagram and in the 2D decay view of the first measurement of the acoustically still untreated room, the levels of the individual peak areas initially fall evenly. Ergo, our goal is not only to reduce the input peak values. We also want to achieve a significantly faster level drop, i.e. a reduction of the reverberation time, with suitable acoustic elements.

3 Conclusions
The decay view illustrates particularly well where room modes are present - for example, at about 70 Hz or also in the range around 200 Hz. In short: As is typical for small rooms, too much bass is the biggest problem in our case. Therefore, we have to primarily treat the bass range with as many modules as possible to optimize the sound there - loosely based on the principle „a lot helps a lot“.
Want more? Get more!


Subscribe to the digital edition of BEAT Magazine via Plugins-Samples.com and get more gear, in-depth workshops, reviews and 11 GB exclusive plugins and new sounds with every monthly issue!
Subscribe to Beat Magazine for only 4.99€ per month